

Petaluma City Schools in Data
Happy back-to-school week to all those who celebrate.
It's a big one in our household: our almost-five-year-old starts TK on Wednesday, our family's first step into the public school system.
When we were deciding to move to Petaluma, the chance to send our kids to wonderful public schools a walk or short drive away was near the top of the list of draws. We feel extraordinarily lucky to have this opportunity. Still, the whole process has been fairly daunting. There are so many schools to choose from in Petaluma, each one offering something slightly different from the next one.
So much of what goes into choosing a school is qualitative. What does your kid naturally gravitate toward, and how well does that match what the school prioritizes?
But there’s some quantitative data that I thought would be useful to get a handle on, too. So I started looking into what kind of public information was out there that might help give us a baseline understanding. Not only to help us with our own decision making process, but to get a better handle on the system as a whole. It was also around the time that the school board announced the $6.1 million budget cut, which I wanted to better understand the implications of.
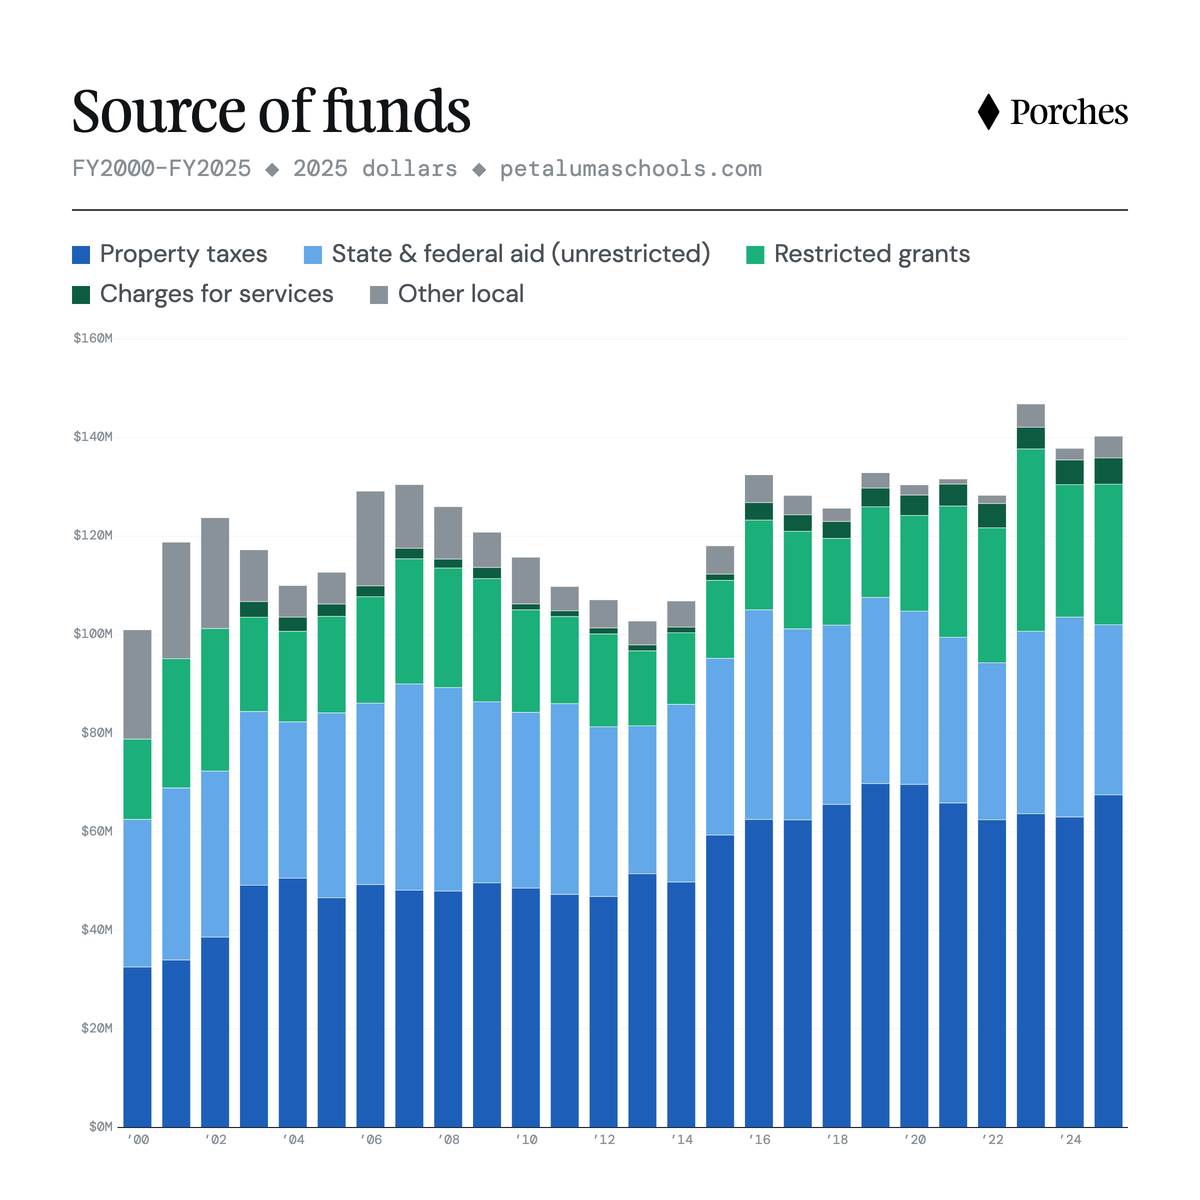
I started building out a little data explorer at https://petalumaschools.com/ with some early findings. It shows the high-level numbers like our overall funding per student and enrollment rates, as well as some more details on finances (where does our funding come from, and where does it go?) and school-level enrollment trends and flows.
There’s a lot to digest, but here are a few highlights that stood out to me:
⭐ Real (inflation-adjusted) per-student spending was flat for many years, then starting rising around a decade ago and recently reached $19,627, about ~33% above its old steady range. The budget cut will trim this number by a bit, but we’ll still be ahead of where we were.
⭐ About 9 in 10 school-aged Petalumans now attend the public schools, up from roughly 3 in 4 in 2000 (while enrollment at Petaluma's private schools has shrunk by about a quarter over that span).
⭐ However, high school enrollment numbers have been on a downward trend since 2006 and are now 22% below their high watermark.
As is often the case with these types of data digs, the more you uncover, the more interesting threads come up to pursue. So I’m planning on using this as a foundation for a series over the next few weeks that will dive into some specific questions and storylines. Here are a few I have queued up:
1 - The budget cut explainer: why it’s happening now, and what we expect to lose.
2 - The missing high school students: why is enrollment sliding, and where are the 8th graders ending up?
3 - School-by-school flows: which schools are growing or shrinking, and why?
I’d also love to hear what else you’re interested in knowing more about, and I'll keep adding to the list. I’m hoping this dashboard and series becomes a useful resource for anyone interested in the public school system in Petaluma. What else are you curious about?